Tableau - Pizza Place Sales Data Analysis
- Emily

- Mar 30, 2023
- 4 min read
Updated: Mar 30, 2023
About our data
The dataset came from Maven Analytics website and consist of a year's worth of sales from a fictitious pizza place, including the date and time of each order and the pizzas served, with additional details on the type, size, quantity, price, and ingredients.
Goal
Our goal for this data analysis is to identify the following:
Average customer per day
Store peak hours
Average number of pizzas per order
Best seller pizzas and pizzas with the least sales
Total sales for the year
Any sales trend or patterns
Promotions the store can take to increase their sales
Understanding the Data
I started the project by importing the csv files in Microsoft Excel to have a quick and clear view of the data types for each dataset.
There were 4 datasets used for this analysis and had the following fields or attributes:
order_details
order_details_id - Unique identifier for each pizza placed within each order (pizzas of the same type and size are kept in the same row, and the quantity increases)
order_id - Foreign key that ties the details in each order to the order itself
pizza_id - Foreign key that ties the pizza ordered to its details, like size and price
quantity - Quantity ordered for each pizza of the same type and size
orders
order_id - Unique identifier for each order placed by a table
date - Date the order was placed (entered into the system prior to cooking & serving)
time - Time the order was placed (entered into the system prior to cooking & serving)
pizzas
pizza_id - Unique identifier for each pizza (constituted by its type and size)
pizza_type_id - Foreign key that ties each pizza to its broader pizza type
size - Size of the pizza (Small, Medium, Large, X Large, or XX Large)
pizza_types
pizza_type_id - Unique identifier for each pizza type
name - Name of the pizza as shown in the menu
category - Category that the pizza fall under in the menu (Classic, Chicken, Supreme, or Veggie)
ingredients - Comma-delimited ingredients used in the pizza as shown in the menu (they all include Mozzarella Cheese, even if not specified; and they all include Tomato Sauce, unless another sauce is specified)
Processing and Transforming the Data
Using Tableau, I created a connection among all datasets by joining them based on existing key constraints and matching fields.

For all data sets, the dates are formatted correctly and I have not found any duplicate rows or null values that may affect our data analysis.
Since the data is clean, I proceeded on adding measures we need for this analysis.
First, I added a new column to calculate Sales by getting the Quantity of each order from order_details table and multiply it by the pizza's Price from pizzas table through the Create Calculated Field.

Next is to calculate the average number of customers per day, I used the Create Calculated Field to count the order id from orders table and divide it by 365.

I also created a calculated field that sums up quantity and orders to identify the average number of pizza per order.

Analysis
Next is going to the data visualization process to identify other metrics for this project.
Using the calculated fields created, let us identify how much is our total sales for the year (2015), the average customer per day, and the average number of pizzas per order.
Total Sales

Average customer per day

Average no of pizza per order

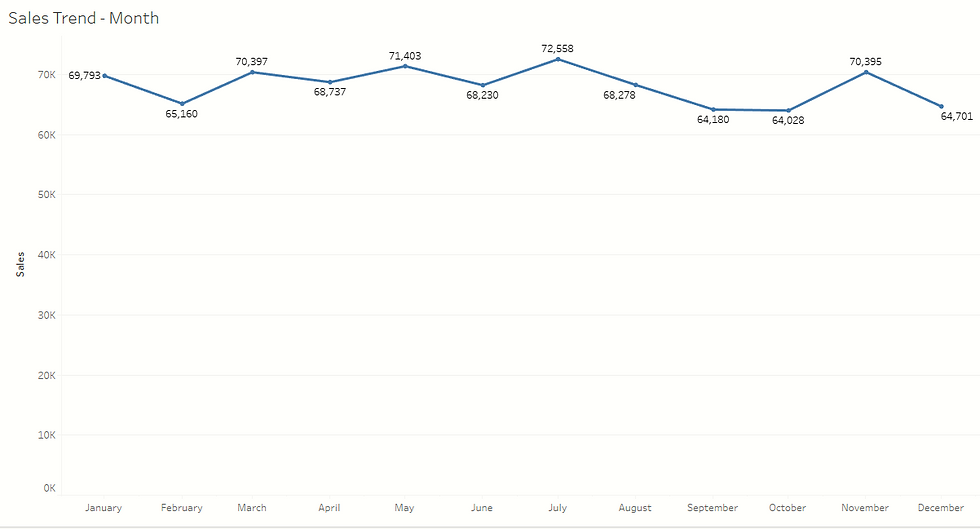
Next, using the Sales and Date fields, I created a line graph to see the sales trend for the year 2015.
We can also see the peak hours and off-peak hours at the store using a line graph.

Next, using a bar graph I was able to identify the top 5 most ordered pizzas and the least ordered pizzas.


To identify the possible cause of low sales for these pizzas, I created a table that displays the top and bottom products' ingredients and average prices. This is to see if there is a common or distinct ingredients among them that made them best sellers or least sellers.


Summary

In 2015, the Pizza Store has a total of $817,860 worth of sales with an average of 58 customers per day.
Looking further, we can also see that in the month of November, the store had reach its highest sales. This might be caused by one of the holidays they had that month which most likely was the Thanksgiving Day.
Additionally, I have identified that the busiest hour for the store is during lunch hours which is from 11 AM until before 2 PM. The off -peak hours starts from 9 AM to 10 AM and the number of customers also gradually decreases in the evening at 9 PM to 11 PM.
Looking at the bottom pizzas by sales, I discovered that the common ingredient they have are Spinach and Artichokes. We can conclude that, although veggie flavored pizzas are good for the health, less customers are likely to buy it on a regular basis. We can also conclude that the Brie Carre Pizza is quite expensive compared to other flavors and customers are less likely to buy it as well on a daily basis.
Recommendations
With these insights, here are some of my recommendations to increase the sales of our Pizza Place store.
To encourage customers to buy vegetarian pizzas, create a limited-time offer deal such as buy 1 plus 1 offer or a discount from pizza's original price. Limited time offer strategy is believed to improve short term sales.
Create limited-time offer deals during store off-peak hours.
Highlight the benefits of vegetarian pizzas and give free taste for their most expensive pizza while highlighting its main ingredient prosciutto.
